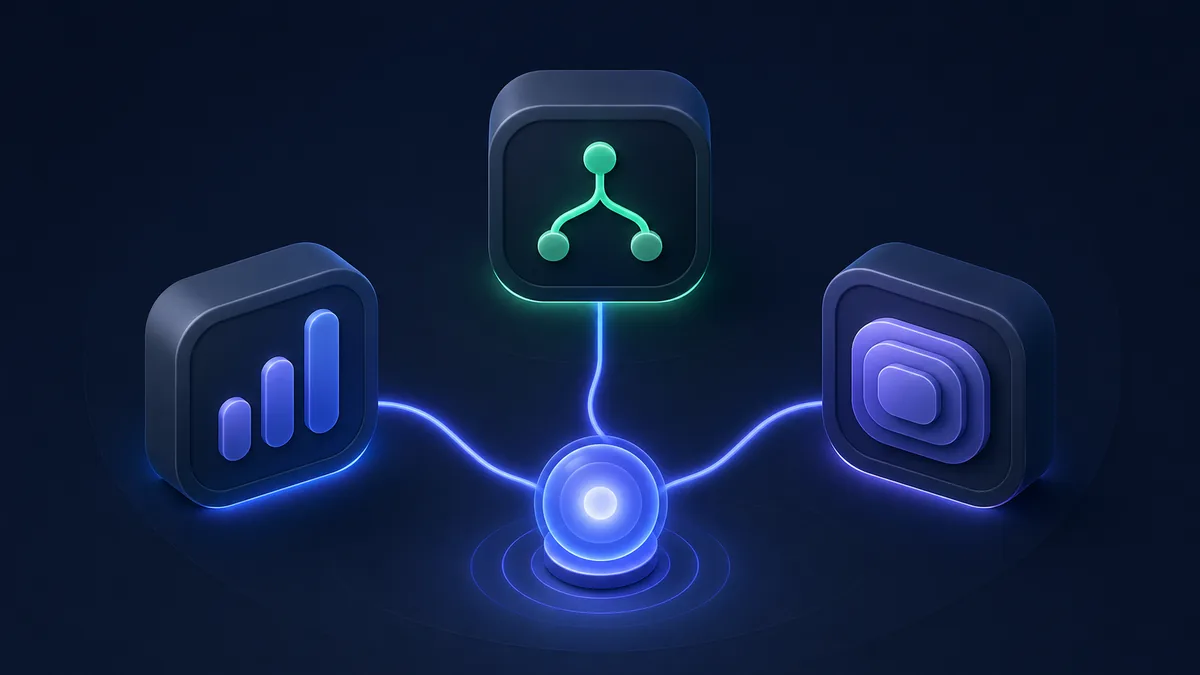
TL;DR
prom-client exposes Prometheus metrics from your Node.js app — request rates, latencies, error rates, custom business metrics. @opentelemetry/api is the vendor-neutral observability standard — instruments traces, metrics, and logs that export to Jaeger, Datadog, Honeycomb, or any OTLP backend. clinic.js is a profiling toolkit — diagnoses CPU bottlenecks, memory leaks, and event loop delays by recording flame graphs and heap snapshots. In 2026: use OpenTelemetry for production observability, prom-client if you're already on a Prometheus stack, and clinic.js for diagnosing performance issues locally.
Key Takeaways
- prom-client: ~3M weekly downloads — Prometheus metrics, pull model (
/metricsendpoint), counters/gauges/histograms - @opentelemetry/api: ~15M weekly downloads — CNCF standard, traces + metrics + logs, zero-code auto-instrumentation
- clinic.js: ~100K weekly downloads — local profiling, flame graphs, heap snapshots, bubble diagrams
- prom-client is best for existing Prometheus/Grafana stacks — simple, battle-tested
- OpenTelemetry auto-instrumentation instruments HTTP, DB, and Redis calls with zero code changes
- clinic.js is a development tool — find WHERE your performance problem is, then fix it
The Monitoring Stack
Observability has three pillars:

Metrics    → Aggregated numbers over time
             "What is the error rate?" "How many req/s?"
             Tools: prom-client, OpenTelemetry metrics

Traces     → Request lifecycle across services
             "Where did this request spend 800ms?"
             Tools: OpenTelemetry traces, Jaeger, Zipkin

Logs       → Discrete events
             "What happened at 14:32:15?"
             Tools: pino, winston → shipped to Loki, Datadog

Profiling  → Code execution analysis
             "Which function is consuming 90% of CPU?"
             Tools: clinic.js, 0x, Node.js --prof

→ Production monitoring: OpenTelemetry (all three pillars)
→ Prometheus stack: prom-client + Grafana
→ Local diagnosis: clinic.js
prom-client
prom-client — Prometheus metrics for Node.js:
Setup
import { Registry, Counter, Histogram, Gauge, collectDefaultMetrics } from "prom-client"

const register = new Registry()

// Auto-collect Node.js process metrics (CPU, memory, event loop lag):
collectDefaultMetrics({ register })

// Custom metrics:
const httpRequestsTotal = new Counter({
  name: "http_requests_total",
  help: "Total number of HTTP requests",
  labelNames: ["method", "route", "status"],
  registers: [register],
})

const httpRequestDuration = new Histogram({
  name: "http_request_duration_seconds",
  help: "HTTP request duration in seconds",
  labelNames: ["method", "route", "status"],
  buckets: [0.005, 0.01, 0.025, 0.05, 0.1, 0.25, 0.5, 1, 2.5, 5, 10],
  registers: [register],
})

const activeConnections = new Gauge({
  name: "active_connections",
  help: "Number of active connections",
  registers: [register],
})
Express middleware
import express from "express"

const app = express()

// Instrument all routes:
app.use((req, res, next) => {
  const timer = httpRequestDuration.startTimer()

  res.on("finish", () => {
    const route = req.route?.path ?? req.path
    timer({
      method: req.method,
      route,
      status: res.statusCode.toString(),
    })
    httpRequestsTotal.inc({
      method: req.method,
      route,
      status: res.statusCode.toString(),
    })
  })

  next()
})

// Expose /metrics endpoint for Prometheus to scrape:
app.get("/metrics", async (req, res) => {
  res.set("Content-Type", register.contentType)
  res.end(await register.metrics())
})

// Business metrics:
app.get("/api/packages/:name", async (req, res) => {
  const pkg = await PackageService.get(req.params.name)

  if (!pkg) {
    return res.status(404).json({ error: "Not found" })
  }

  // Track business event:
  packageLookupsTotal.inc({ packageName: req.params.name })
  res.json(pkg)
})
Grafana dashboard queries
# Request rate (per second, 5-minute window):
rate(http_requests_total[5m])

# p95 latency:
histogram_quantile(0.95, rate(http_request_duration_seconds_bucket[5m]))

# Error rate:
rate(http_requests_total{status=~"5.."}[5m]) /
rate(http_requests_total[5m])

# Memory usage:
nodejs_heap_size_used_bytes / nodejs_heap_size_total_bytes
@opentelemetry/api
OpenTelemetry — vendor-neutral observability:
Auto-instrumentation (zero code)
npm install @opentelemetry/auto-instrumentations-node \
            @opentelemetry/sdk-node \
            @opentelemetry/exporter-trace-otlp-http
// instrumentation.ts — import BEFORE your app code:
import { NodeSDK } from "@opentelemetry/sdk-node"
import { getNodeAutoInstrumentations } from "@opentelemetry/auto-instrumentations-node"
import { OTLPTraceExporter } from "@opentelemetry/exporter-trace-otlp-http"
import { OTLPMetricExporter } from "@opentelemetry/exporter-metrics-otlp-http"
import { PeriodicExportingMetricReader } from "@opentelemetry/sdk-metrics"

const sdk = new NodeSDK({
  serviceName: "pkgpulse-api",
  traceExporter: new OTLPTraceExporter({
    url: "http://jaeger:4318/v1/traces",
  }),
  metricReader: new PeriodicExportingMetricReader({
    exporter: new OTLPMetricExporter({
      url: "http://prometheus-otel-collector:4318/v1/metrics",
    }),
  }),
  // Auto-instruments: http, express, pg, mongodb, redis, grpc, etc.:
  instrumentations: [getNodeAutoInstrumentations()],
})

sdk.start()
# Start with instrumentation:
node --require ./instrumentation.js dist/index.js
Manual tracing
import { trace, SpanStatusCode, context, propagation } from "@opentelemetry/api"

const tracer = trace.getTracer("pkgpulse-api", "1.0.0")

async function getPackageWithHealthScore(name: string) {
  // Create a span for this operation:
  return tracer.startActiveSpan(`getPackage:${name}`, async (span) => {
    span.setAttribute("package.name", name)

    try {
      // Child spans are created automatically for DB and HTTP calls:
      const pkg = await db.packages.findFirst({ where: { name } })
      const npmData = await npmClient.getStats(name)  // Traced automatically

      const score = calculateScore(pkg, npmData)
      span.setAttribute("package.health_score", score)

      return { ...pkg, healthScore: score }
    } catch (error) {
      span.recordException(error as Error)
      span.setStatus({ code: SpanStatusCode.ERROR })
      throw error
    } finally {
      span.end()
    }
  })
}
Custom metrics
import { metrics } from "@opentelemetry/api"

const meter = metrics.getMeter("pkgpulse-api")

const requestCounter = meter.createCounter("http.requests", {
  description: "Total HTTP requests",
})

const requestDuration = meter.createHistogram("http.request.duration", {
  description: "HTTP request duration",
  unit: "ms",
})

// Usage:
requestCounter.add(1, { method: "GET", route: "/api/packages/:name" })
requestDuration.record(150, { method: "GET", status: "200" })
clinic.js
clinic.js — local performance profiling:
Doctor (all-in-one diagnosis)
npm install -g clinic

# Run Doctor — detects: CPU, memory, event loop issues:
clinic doctor -- node dist/index.js

# Under load (use autocannon):
clinic doctor -- node dist/index.js &
npx autocannon -d 30 -c 50 http://localhost:3000/api/packages/react

# Opens flame graph in browser automatically
Flame (CPU profiling)
# Collect CPU flame graph:
clinic flame -- node dist/index.js

# Apply load:
npx autocannon -d 15 -c 20 http://localhost:3000/api/packages/react

# Opens flame graph — thick bars = hot code paths
Heap (memory analysis)
# Detect memory leaks:
clinic heapprofiler -- node dist/index.js

# Or with autocannon running
# Shows heap allocation over time
Bubble diagram interpretation
clinic doctor output:

⬤ CPU circle:   large = CPU-bound (optimize sync code, avoid blocking)
⬤ Memory circle: large = heap growth (memory leak, cache unbounded)
⬤ Delay circle:  large = event loop blocking (sync I/O, JSON.parse on large data)
⬤ Handles circle: large = too many open handles (connections not closed)

Common findings:
  "I/O Issue" → Event loop blocked waiting for I/O (use async, use worker threads)
  "CPU Issue" → Hot synchronous code (profile with flame, optimize the fat bars)
  "Memory Issue" → Heap growing → find leak with heapprofiler
Feature Comparison
| Feature | prom-client | @opentelemetry/api | clinic.js |
|---|---|---|---|
| Metrics | ✅ | ✅ | ❌ |
| Distributed traces | ❌ | ✅ | ❌ |
| CPU profiling | ❌ | ❌ | ✅ |
| Memory profiling | ❌ | ❌ | ✅ |
| Event loop monitoring | ✅ (collectDefaultMetrics) | ✅ | ✅ |
| Auto-instrumentation | ❌ | ✅ | N/A |
| Pull model | ✅ (/metrics endpoint) | configurable | N/A |
| Push model | ❌ | ✅ (OTLP push) | N/A |
| Cloud backends | Grafana | Datadog/Honeycomb/Jaeger | Local only |
| Weekly downloads | ~3M | ~15M | ~100K |
When to Use Each
Choose prom-client if:
- Already running Prometheus + Grafana (most common ops stack)
- Need simple counter/gauge/histogram metrics with low overhead
- Team is familiar with PromQL and Grafana dashboards
Choose @opentelemetry/api if:
- Building microservices — distributed tracing is essential
- Want vendor flexibility (can switch from Jaeger to Honeycomb to Datadog)
- Need auto-instrumentation of HTTP, database, Redis with zero code
- Greenfield project — OpenTelemetry is the 2026 standard
Choose clinic.js if:
- Diagnosing a specific performance issue (high CPU, memory leak, latency spike)
- Need flame graphs to identify hot code paths
- Want to understand Node.js event loop behavior under load
- Development and debugging (not for production monitoring)
Use all three together:
clinic.js → Identify the problem (dev)
OpenTelemetry → Monitor in production (observability)
prom-client → If you need specific Prometheus metrics
OpenTelemetry Auto-Instrumentation vs prom-client Manual Instrumentation
The most significant architectural difference between OpenTelemetry and prom-client is how instrumentation gets into your code. prom-client requires you to explicitly create metric objects and call .inc(), .observe(), or .startTimer() at the appropriate points in your code. This is deliberate and gives you precise control over what gets measured and how, but it means instrumentation is an ongoing development task — every new route, database call, or background job needs explicit counter and histogram code added.
OpenTelemetry's auto-instrumentation takes the opposite approach: getNodeAutoInstrumentations() patches the Node.js module system at startup, intercepting known libraries (http, express, fastify, pg, mysql2, redis, mongodb, graphql, and dozens more) and automatically creating spans and metrics for every operation. A single --require ./instrumentation.js flag before your app starts instruments your entire HTTP layer, database layer, and cache layer without any code changes. The quality of this auto-instrumentation has improved substantially — OpenTelemetry's @opentelemetry/instrumentation-http correctly propagates trace context across HTTP calls, enabling end-to-end distributed tracing across microservices without any custom span creation.
The trade-off is that auto-instrumentation creates spans for everything, including noise you don't care about (health check routes, static file requests, internal polling). Sampling is the solution: configure the TraceIdRatioBased sampler at 10-20% for high-volume routes and 100% for error traces, so you capture complete data for failures while sampling routine successful requests. prom-client's counter/histogram model naturally aggregates this — you always have complete request counts and latency distributions regardless of trace sampling rate.
prom-client Metric Types: When to Use Each
Understanding which prom-client metric type fits each use case prevents common monitoring mistakes. Counters (new Counter) are monotonically increasing and can only go up — they represent totals like request counts, error counts, and bytes sent. The value itself is less interesting than its rate: rate(http_requests_total[5m]) gives requests per second over a 5-minute window. Never use a counter for things that go down (queue depth, active connections) — that's what Gauges are for.
Gauges (new Gauge) represent instantaneous values that can increase or decrease: number of active WebSocket connections, current queue depth, cache hit ratio, heap memory in use. Because Prometheus scrapes metrics on its own schedule (typically every 15 seconds), gauge values represent snapshots, not continuous tracking. For values that change between scrapes (like a request currently processing), you need to actively call .set() or use .inc()/.dec() in middleware.
Histograms (new Histogram) are the right type for latency, request size, and response size — anything where you want percentiles. The buckets array defines the upper bounds of latency buckets; the default buckets are conservative (up to 10 seconds), so for fast internal APIs you'll want custom buckets like [0.001, 0.005, 0.01, 0.025, 0.05, 0.1, 0.25, 0.5, 1] (1ms to 1000ms). The histogram_quantile(0.99, ...) PromQL function then gives you the 99th percentile latency, which is far more actionable than averages for diagnosing tail latency issues.
clinic.js Workflow for Real Investigations
clinic.js is most effective when used as part of a structured diagnosis workflow rather than run once and hoped for insight. The standard approach is: first run clinic doctor with a load generator to get the high-level bubble diagram, identify which pillar (CPU, memory, event loop, I/O) shows the problem, then use the specific tool (clinic flame for CPU, clinic heapprofiler for memory) to drill down.
The flame graph from clinic flame shows call stacks as proportional horizontal bars: wide bars mean functions executing frequently. Identifying a performance regression becomes mechanical — run flame before and after a change and compare the width of relevant function bars. The most common findings in Node.js HTTP APIs are: synchronous JSON serialization of large objects on the hot path (use streaming serializers like fast-json-stringify), unindexed database query patterns that execute per-request (shows up as wide database driver bars), and synchronous crypto operations that should move to worker threads.
For memory leak diagnosis, clinic heapprofiler generates heap allocation timelines. A memory leak appears as a steadily growing allocated bytes line that doesn't return to baseline between requests. The allocation site view shows which callsite is allocating the most retained memory — retained, not allocated, because short-lived allocations that are garbage collected aren't leaks. Common sources: unbounded cache growth (use LRU caches with explicit size limits), event listener accumulation (add listeners without corresponding removeListener calls), and closure references holding large objects longer than expected. clinic.js won't fix the leak for you, but it reliably identifies the file and function responsible in minutes versus days of manual investigation.
Methodology
Download data from npm registry (weekly average, February 2026). Feature comparison based on prom-client v15.x, @opentelemetry/api v1.x, and clinic.js v13.x.
The practical observability setup for a Node.js service in 2026 is not an either-or choice between these tools. OpenTelemetry auto-instrumentation is the foundation — it covers HTTP, database, and cache spans with zero application code. prom-client adds business-level metrics that OpenTelemetry's generic instrumentation does not capture: checkout conversion rates, queue depths by queue name, or package lookup counts by package. clinic.js operates at a different layer entirely, surfacing execution-level performance problems that neither metrics nor traces can reveal — flame graphs show which functions are consuming CPU, and heap profiler timelines identify which code paths allocate memory that outlives the request lifecycle. Using all three together creates complete coverage: production observability through OpenTelemetry, business metric dashboards through prom-client, and targeted performance diagnosis through clinic.js.
Compare monitoring and observability packages on PkgPulse →
See also: pm2 vs node:cluster vs tsx watch and h3 vs polka vs koa 2026, better-sqlite3 vs libsql vs sql.js.